Home Assistant Tibber Preise 15 Minuten intervall
In dieser Anleitung zeige ich dir wie man die Tibber Preise der nächsten Tage abholt und in HomeAssistant integriert.
Um diese Grafik erstellen zu lassen könnt ihr erstmal meine anderen Artikel dazu lesen.
Da ich jetzt hier nur auf die Änderung der API Schnittelle eingehen werde.
Mittels der Files Editor Integration könnt wir ganz bequem die secrets.yaml editieren.
Da wir hier den API Key hinterlegen werden.
# Use this file to store secrets like usernames and passwords.
# Learn more at https://www.home-assistant.io/docs/configuration/secrets/
TIBBER_API_KEY: TIBBER-API-KEY-HIER-EINTRAGEN
Dann editeren wir die configuration.yaml um unter Sensor: den API Call an die Tibber API zu erstellen.
Bei „platform: rest“ rufen wir die Tibber API auf um dort an die Daten für die nächsten Tage zu kommen.
Weitere Informationen finden man auch im Changelog von Tibber https://developer.tibber.com/docs/changelog
Hier muss eigentich nur bei priceinfo das hinzugefügt werden
priceInfo (resolution: QUARTER_HOURLY)
sensor:

  # Tibber API
  - platform: rest
    name: "Electricity price Prognose ADRESSE"
    unique_id: sensor.electricity_price_prognose_ADRESSE
    resource: https://api.tibber.com/v1-beta/gql
    method: POST
    payload: '{ "query": "{ viewer { homes { currentSubscription { status priceInfo (resolution: QUARTER_HOURLY) { current { total } today { total } tomorrow { total } } } } } }" }'
    json_attributes_path: "$.data.viewer.homes[0].currentSubscription.priceInfo"
    json_attributes:
      - today
      - tomorrow
    value_template: "{{ value_json.data.viewer.homes[0].currentSubscription.priceInfo.current.total | float }}"
    scan_interval: 300
    headers:
      Authorization: !secret TIBBER_API_KEY
      Content-Type: application/json
      User-Agent: REST
    unit_of_measurement: EUR/kWh
Wenn Ihr den alten Sensor nur aktualisiert. Werden erst die neuen Daten in dem Sensor auftauchen, wenn es neue Daten von Tibber gibt. Alte Daten werden nicht überschrieben.
Ich hab bei mir beide Sensoren drin. Einmal Stündlich und einmal 15 Min
sensor:

  # Tibber API HOURLY
  - platform: rest
    name: "Electricity price Prognose ADRESSE"
    unique_id: sensor.electricity_price_prognose_ADRESSE
    unit_of_measurement: EUR/kWh
    resource: https://api.tibber.com/v1-beta/gql
    method: POST
    payload: '{ "query": "{ viewer { homes { currentSubscription { status priceInfo (resolution: HOURLY) { current { total } today { total } tomorrow { total } } } } } }" }'
    json_attributes_path: "$.data.viewer.homes[0].currentSubscription.priceInfo"
    json_attributes:
      - today
      - tomorrow
    value_template: "{{ value_json.data.viewer.homes[0].currentSubscription.priceInfo.current.total | float }}"
    scan_interval: 300
    headers:
      Authorization: !secret TIBBER_API_KEY
      Content-Type: application/json
      User-Agent: REST

  # Tibber API QUARTER_HOURLY
  - platform: rest
    name: "Electricity price Prognose 15Min ADRESSE"
    unique_id: sensor.electricity_price_prognose_15min_ADRESSE
    unit_of_measurement: EUR/kWh
    resource: https://api.tibber.com/v1-beta/gql
    method: POST
    payload: '{ "query": "{ viewer { homes { currentSubscription { status priceInfo (resolution: QUARTER_HOURLY) { current { total } today { total } tomorrow { total } } } } } }" }'
    json_attributes_path: "$.data.viewer.homes[0].currentSubscription.priceInfo"
    json_attributes:
      - today
      - tomorrow
    value_template: "{{ value_json.data.viewer.homes[0].currentSubscription.priceInfo.current.total | float }}"
    scan_interval: 300
    headers:
      Authorization: !secret TIBBER_API_KEY
      Content-Type: application/json
      User-Agent: REST
Wenn die Anpassungen vorgenommen wurden muss einmal Home Assistent neu gestartet werden. Das kann gleich beim File Editor oben rechts beim Zahnrad erledigt werden.
Dann wechsel wir zum Dashbord und erstellen eine neue Karte.
Hier könnt ihr gerne erstmals mittels Sensor Karte die neuen Sensoren suchen.
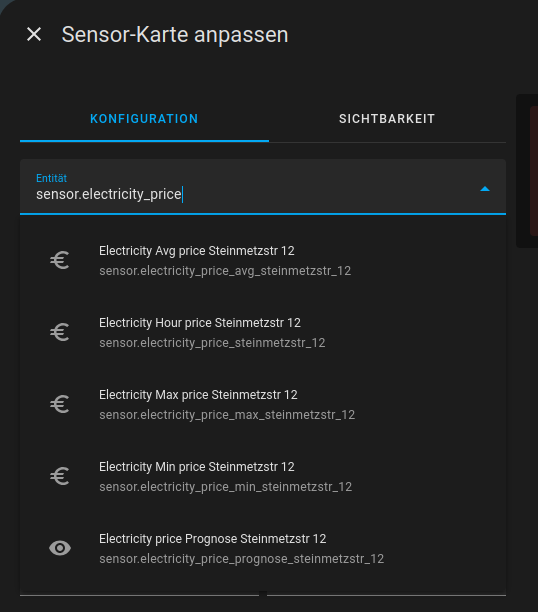
Diese sollten dann nach ein paar Minuten, auch Daten liefern.
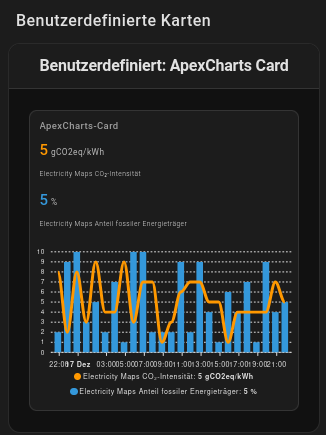
Wenn die Sensoren dann Daten haben könnt ihr auch dann die Benutzerdefinierte Karte anlegen.
Dort wählen wir dann unter Benutzerdefinierten Karten die ApexCharts-Card aus.
Und in dem Quellcode Bereich der Karte ersetzen wir den Inhalt mit dem Folgenden Code.
Das ist für 15 Minuten daten ausgelegt
Bitte beachtet das ihr die Sensoren richtig benennt, bei mir fangen die immer mit sensor.electricity_price_ an.
Auch hier muss wieder bei den Sensoren die ADRESSE durch eure Adresse / Sensor Namen ersetzt werden
also
„- entity: sensor.electricity_price_prognose_ADRESSE“ mit
„- entity: sensor.electricity_price_prognose_steinmetzstr_12„
und so weiter.
Ganz unten gibt es noch die entity: sensor.smd630_energy_today hier könnt ihr euren gemessenen Verbrauch eintragen. Bei mir ist es ein Separater Stromzähler den ich auslese.
type: custom:apexcharts-card
experimental:
hidden_by_default: true
graph_span: 48h
brush:
selection_span: 40h
apex_config:
enable: true
autoScaleYaxis: false
apex_config:
chart:
zoom:
enabled: true
toolbar:
show: true
tools:
zoom: true
zoomin: true
zoomout: true
pan: true
reset: true
download: false
legend:
show: false
stroke:
show: true
width: 2
all_series_config:
stroke_width: 2
span:
start: hour
offset: "-26h"
now:
show: true
update_interval: 5min
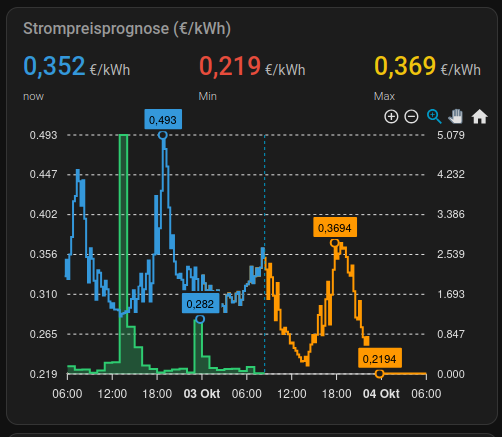
header:
show: true
title: Strompreisprognose (€/kWh)
show_states: true
colorize_states: true
yaxis:
- id: left
decimals: 3
opposite: false
- id: right
decimals: 3
opposite: true
min: 0
series:
- entity: sensor.electricity_price_prognose_15min_ADRESSE
yaxis_id: left
name: Future_15
type: line
float_precision: 5
curve: stepline
unit: €/kWh
show:
in_header: false
extremas: true
legend_value: false
data_generator: |
const noon = new Date()
noon.setHours(0, 0, 0, 0)
const prices = entity.attributes.today.concat(entity.attributes.tomorrow);
const data = [];
for(let i = 0; i < prices.length; i++) {
data.push([noon.getTime() + i * 1000 * 900, prices[i].total])
}
return data;
- entity: sensor.electricity_price_ADRESSE
yaxis_id: left
name: now
type: line
float_precision: 5
curve: stepline
unit: €/kWh
extend_to: now
show:
in_header: true
extremas: true
legend_value: false
- entity: sensor.electricity_price_min_ADRESSE
yaxis_id: left
name: Min
type: line
float_precision: 5
curve: stepline
unit: €/kWh
extend_to: now
fill_raw: last
show:
hidden_by_default: true
legend_value: false
- entity: sensor.electricity_price_avg_ADRESSE
yaxis_id: left
name: Avg
type: line
float_precision: 5
curve: stepline
unit: €/kWh
extend_to: now
fill_raw: last
show:
hidden_by_default: true
legend_value: false
in_header: false
- entity: sensor.electricity_price_max_ADRESSE
yaxis_id: left
name: Max
type: line
float_precision: 5
curve: stepline
unit: €/kWh
extend_to: now
fill_raw: last
show:
hidden_by_default: true
legend_value: false
- entity: sensor.smd630_energy_today
yaxis_id: right
name: Bezug
curve: stepline
type: area
opacity: 0.3
extend_to: now
show:
in_header: false
legend_value: false
group_by:
func: delta
duration: 1h
fill: zero

Viel Spass beim nachbauen
Wenn ihr noch die stündlichen haben wollt, ändert ihr das dick makierte von 900 auf 3600
- entity: sensor.electricity_price_prognose_ADRESSE
    yaxis_id: left
    name: Future_60
    type: line
    float_precision: 5
    curve: stepline
    unit: €/kWh
    show:
      in_header: false
      extremas: true
      legend_value: false
    data_generator: |
      const noon = new Date()
      noon.setHours(0, 0, 0, 0)
      const prices = entity.attributes.today.concat(entity.attributes.tomorrow);
      const data = [];
      for(let i = 0; i < prices.length; i++) {
        data.push([noon.getTime() + i * 1000 * 3600, prices[i].total])
      }
      return data;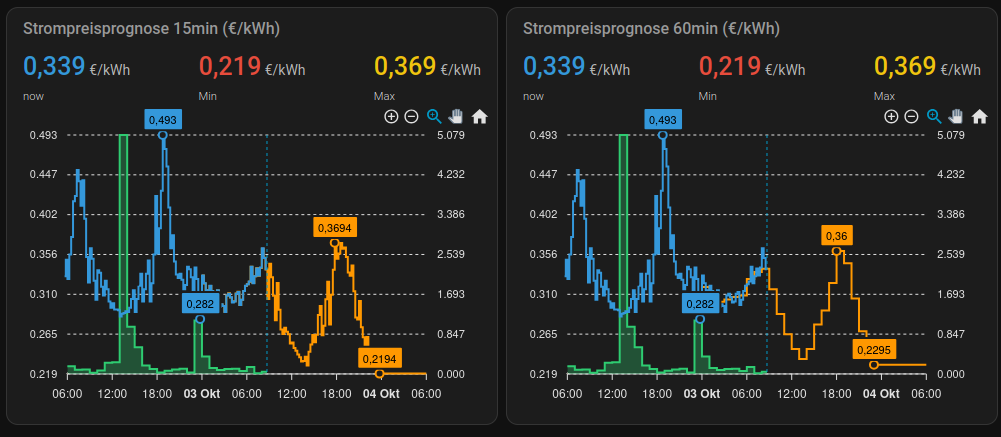
ja und weil heute gerade feiertag war. Machen wir doch die Graphen noch etwas bunter
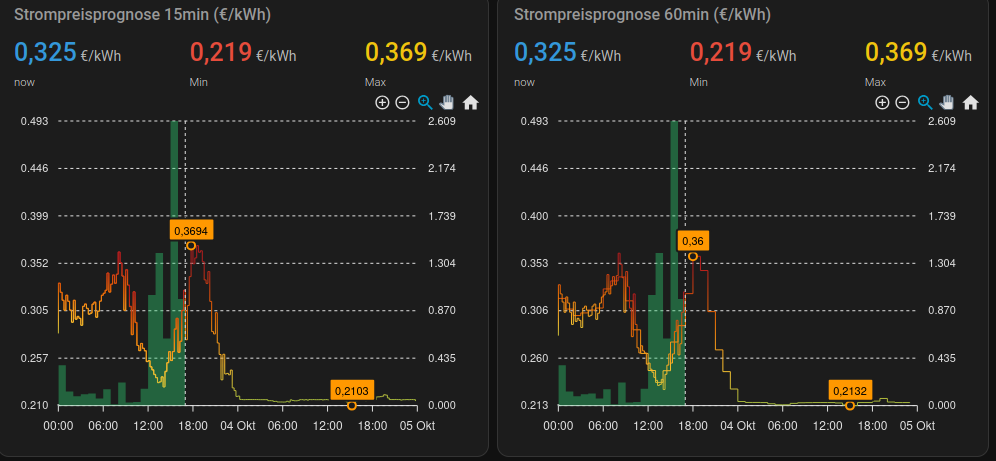
15 Min
type: custom:apexcharts-card
header:
  show: true
  title: Strompreisprognose 15min (€/kWh)
  show_states: true
  colorize_states: true
  standard_format: false
experimental:
  hidden_by_default: true
  color_threshold: true
brush:
  selection_span: 40h
  apex_config:
    enable: true
    autoScaleYaxis: false
apex_config:
  grid:
    show: true
    borderColor: "#E0E0E0"
  chart:
    height: 350px
    zoom:
      enabled: true
    toolbar:
      show: true
      tools:
        zoom: true
        zoomin: true
        zoomout: true
        pan: true
        reset: true
        download: false
  tooltip:
    enabled: true
    followCursor: false
    x:
      show: false
    fixed:
      enabled: true
  legend:
    show: false
graph_span: 48h
span:
  start: day
now:
  show: true
  color: E0E0E0
update_interval: 5min
yaxis:
  - id: left
    show: true
    opposite: false
    decimals: 3
  - id: right
    show: true
    opposite: true
    decimals: 3
    min: 0
series:
  - entity: sensor.electricity_price_prognose_15min_steinmetzstr_12
    yaxis_id: left
    name: Future15
    type: line
    curve: stepline
    stroke_width: 1
    float_precision: 5
    unit: €/kWh
    extend_to: false
    show:
      in_header: false
      name_in_header: false
      extremas: true
      legend_value: false
    color_threshold:
      - value: 0
        color: 4DD0E1
      - value: 0.1
        color: 26A69A
      - value: 0.15
        color: 4CAF50
      - value: 0.2
        color: 7CB342
      - value: 0.25
        color: FBC02D
      - value: 0.3
        color: EF6C00
      - value: 0.35
        color: B71C1C
    data_generator: |
      const noon = new Date()
      noon.setHours(0, 0, 0, 0)
      const prices = entity.attributes.today.concat(entity.attributes.tomorrow);
      const data = [];
      for(let i = 0; i < prices.length; i++) {
        data.push([noon.getTime() + i * 1000 * 900, prices[i].total])
      }
      return data;
  - entity: sensor.electricity_price_steinmetzstr_12
    yaxis_id: left
    name: now
    type: line
    curve: stepline
    stroke_width: 1
    float_precision: 5
    unit: €/kWh
    extend_to: now
    show:
      in_header: true
      name_in_header: true
      extremas: false
      legend_value: false
    color_threshold:
      - value: 0
        color: 4DD0E1
      - value: 0.1
        color: 26A69A
      - value: 0.15
        color: 4CAF50
      - value: 0.2
        color: 7CB342
      - value: 0.25
        color: FBC02D
      - value: 0.3
        color: EF6C00
      - value: 0.35
        color: B71C1C
  - entity: sensor.electricity_price_min_steinmetzstr_12
    yaxis_id: left
    name: Min
    type: line
    curve: stepline
    stroke_width: 0
    float_precision: 5
    unit: €/kWh
    extend_to: now
    fill_raw: last
    show:
      hidden_by_default: true
      in_header: true
      name_in_header: true
      extremas: false
      legend_value: false
  - entity: sensor.electricity_price_avg_steinmetzstr_12
    yaxis_id: left
    name: Avg
    type: line
    curve: stepline
    stroke_width: 0
    float_precision: 5
    unit: €/kWh
    extend_to: now
    fill_raw: last
    show:
      hidden_by_default: true
      in_header: false
      name_in_header: true
      extremas: false
      legend_value: false
  - entity: sensor.electricity_price_max_steinmetzstr_12
    yaxis_id: left
    name: Max
    type: line
    curve: stepline
    stroke_width: 0
    float_precision: 5
    unit: €/kWh
    extend_to: now
    fill_raw: last
    show:
      hidden_by_default: true
      in_header: true
      name_in_header: true
      extremas: false
      legend_value: false
  - entity: sensor.smd630_energy_today
    yaxis_id: right
    name: Bezug
    type: area
    curve: stepline
    stroke_width: 0
    opacity: 0.4
    extend_to: now
    show:
      in_header: false
      name_in_header: true
      extremas: false
      legend_value: false
    group_by:
      func: delta
      duration: 1h
      fill: zero
Super Cool. Habs umgebaut, läuft wie am Schnürchen und sieht echt schick aus! Danke für deinen Support.
Hat funktioniert, danke!
1.000 Dank :-)
Ich hätte da noch einen verbesserungsvorschlag um die Wiederholung von Code zu reduzieren und damit auch die Fehlerquellen:
„`
– &tibber_common
platform: rest
unit_of_measurement: EUR/kWh
scan_interval: 300
method: POST
resource: https://api.tibber.com/v1-beta/gql
headers:
Authorization: !secret TIBBER_API_KEY
Content-Type: application/json
User-Agent: REST
json_attributes_path: „$.data.viewer.homes[0].currentSubscription.priceInfo“
json_attributes:
– today
– tomorrow
value_template: „{{ value_json.data.viewer.homes[0].currentSubscription.priceInfo.current.total | float }}“
# Tibber API HOURLY
– <<: *tibber_common
name: "Electricity price Prognose"
unique_id: sensor.electricity_price_prognose
payload: '{ "query": "{ viewer { homes { currentSubscription { status priceInfo (resolution: HOURLY) { current { total } today { total } tomorrow { total } } } } } }" }'
# Tibber API QUARTER_HOURLY
– <<: *tibber_common
name: "Electricity price Prognose 15Min"
unique_id: sensor.electricity_price_prognose_15min
payload: '{ "query": "{ viewer { homes { currentSubscription { status priceInfo (resolution: QUARTER_HOURLY) { current { total } today { total } tomorrow { total } } } } } }" }'
„`
Oh wie schön alles funktioniert bestens.
vielen Dank
Sehr cool!
Hat jemand eine Idee, wie man den stündlichen Verbrauch von der Tibber Integration heraus bekommt bzw. genauso wie bei dir angezeigt bekommt? Wenn man den Wert nehmen würde, den die Integration liefert, hätte man das ja nicht so stündlich aufgelöst.
Ich hab bei mir einen Separaten Stromzähler installiert, der die Live Daten erfasst.
Was du machen könntest ist einen Virtuellen Stromzähler zu erstellen.
Unter Geräte & Dienste –> Helfer –> Integralsensor
Metrisches Präfix -> Kilo
Zeiteinheit -> Stunden
Eingangssensor -> Tibber Integration -> Einspeiseleistung
Integrationsmethode -> Trapetzregel
Genauigkeit -> 2 (wäre dann 2,01 kWh)
Dann Rechnet der Integralsensor die Watt zusammen und macht daraus kWh